Fairfield County’s Community Foundation envisions a vital and inclusive community where every individual has the opportunity to thrive. But without good data, we cannot measure our progress towards that vision. We are excited to share highlights from the Fairfield County Community Wellbeing Index 2016 to inspire reflection and dialogue.

Bethel, Bridgeport, Brookfield, Danbury, Darien, Easton, Fairfield, Greenwich, Monroe, New Canaan, Newtown, New Fairfield, Norwalk, Redding, Ridgefield, Shelton, Sherman, Stamford, Stratford, Trumbull, Weston, Westport, Wilton
Produced in partnership with DataHaven, this comprehensive 80-page report helps us better understand the complex issues facing our neighborhoods, towns and county, as well as where we are headed. By focusing on the interrelationship between quality of life, health and economic competitiveness of Fairfield County, we can better appreciate our successes and acknowledge our challenges.
WHAT YOU CAN DO:
READ the full report.
ANALYZE the data.
ADVOCATE for the issues affecting you and your community.
COLLABORATE with key stake-holders, including legislators, nonprofits and businesses to create sector-wide solutions.
JOIN US as we host future community conversations on the Community Wellbeing Index.
An updated Community Wellbeing Index was released in 2019, click here to download.
For more insights and reflections on the Index, watch our recently broadcast webinar.
A Changing County
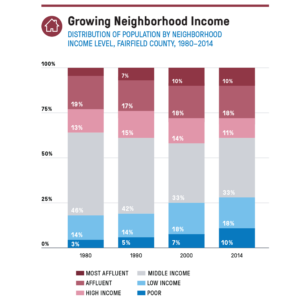
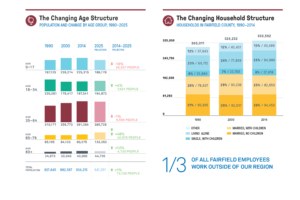
By nearly all measures, Fairfield County has changed in ways that affect both the current and future wellbeing of the county. The county’s total population is projected to increase by only 1% by 2025, and over the next decade, older adults (age 65 and older) are the only segment of the population projected to increase significantly in size. Our county is becoming more diverse racially and ethnically, and we are seeing growing segregation in our county by income. Lastly, the changing structure of Fairfield County households will continue to have an impact on the type of housing that is in demand in the county.
“Among the population ages 0–17 in Fairfield County, 36% of African Americans and 30% of Latinos live in poor neighborhoods, compared to 1% of whites.”
Health in our County
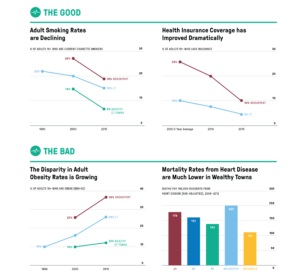
The typical Fairfield County resident reports levels of health and personal wellbeing that are better than those in other parts of the state and country. The high health status for the county as a whole hides vast differences. Towns and neighborhoods differ by age structure, race, and economic status which greatly affect the burden and types of health conditions that are of concern in each community. The full report contains tables and maps that describe neighborhood-level health issues and barriers to good health.
A County of Opportunity?
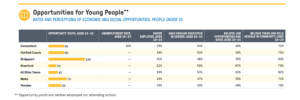
The official unemployment rate for workers ages 16 to 24 was 10% in 2015, yet a quarter of all young workers reported being under-employed: either unemployed and looking for work, or currently working part-time but preferring full-time work.
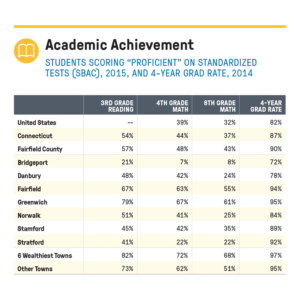
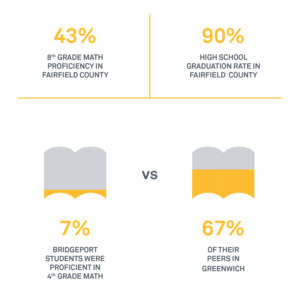
90% of Fairfield County’s high school seniors, including 72% of those in Bridgeport, graduated from high school on time. But out of those who graduated, just 56% of Bridgeport students, as compared to 89% of their peers in the 6 wealthiest towns, enrolled in college within one year.
In 2015, high-needs* Fairfield County students of any grade passed the SBAC reading test at half the rate of non-high needs students.
* High needs students include those who: take special education classes, qualify for free or reduced price meals, or are English language learners (ELL).
54% OF FAIRFIELD COUNTY PUBLIC SCHOOL GRADUATES EARN A COLLEGE DEGREE (2-YEAR OR 4-YEAR) IN 6 YEARS
